Prepared by:
Carrie E. Henderson, Ph.D.
TSG Advisors – Education
henderson@tsgadvisors.com
Date:
April 29, 2026
Executive Summary
The 2025 Florida CTE Program Quality Audit assessed 3,630 unique postsecondary CTE programs across reporting years 2021-22, 2022-23, and 2023-24. Under the audit's three quality metrics, 134 agency-level programs would have been identified for phase out if the 2026 accountability standards were already in effect. The 2026 cycle will be the first under which phase-out consequences attach: programs that do not meet all applicable metrics will be required either to phase out or to submit evidence supporting continuation within 45 days of notification. This gives agencies a single program year to interpret the 2025 results and respond.
This brief is organized in two parts. Part 1 disaggregates the 134 identifications by metric, program cluster, institution, and likely contributing factor, surfacing four findings that suggest the population of programs identified primarily on program-level performance differences is meaningfully smaller than the headline figure implies. Part 2 translates those findings into five practical steps that postsecondary agencies can take in the program year before consequences take effect.

Of the 134 identifications, 87 were on Metric 2 (Continuing Education or Employment), 30 on Metric 3 (In-Demand Occupation), and 17 on Metric 1 (Retention or Success).
Background: The Florida CTE Program Quality Audit
The Florida CTE Program Quality Audit was established under Rule 6A-10.0342, F.A.C., aligned with section 1003.491(5), Florida Statutes, and satisfies the data collection requirement of section 1003.492, F.S. Since 2019, it has evolved into Florida's primary mechanism for evaluating postsecondary CTE program quality at scale. The audit applies three metrics to each program. Each metric has a primary target tied to the most recent reporting year and an alternate target tied to a three-year average; a program meets the metric if it satisfies either target.
Metric 1 (Retention or Success) measures whether students re-enroll, complete, or transfer within the program year. Metric 2 (Continuing Education or Employment) measures whether completers continue education or are employed within one year, with employment determined through Florida Education and Training Placement Information Program (FETPIP) wage record matches. Metric 3 (In-Demand Occupation) requires the program to appear on the most recent Master Credentials List (MCL) or, alternatively, to have evidence of labor market value documented in the agency's most recent Comprehensive Local Needs Assessment (CLNA). Programs are exempt from accountability outcomes if they are new (within three years of state approval), in teach out at the state or local level, or have fewer than ten students in the denominator for the most recent reporting year of a metric.
Methodology
This brief draws on multiple source files: the 2025 Postsecondary CTE Audit Business Rules, the 2025 CTE Program Quality Audit Report, the course and program inventory, and the Master Credentials List. Analysis proceeded in four steps. First, the 134 identified programs were grouped by metric to attribute each identification to its driving criterion. Second, identifications were grouped by program title to surface clusters with shared structural characteristics. Third, identifications were aggregated at the agency level to examine institutional concentration. Fourth, the CIP code for each identified program was cross-checked against the CIP replacement crosswalk and the Master Credentials List to determine whether identifications on Metric 3 reflect programs whose legacy CIP has been superseded by a replacement CIP that already appears on the MCL.
All counts in this brief reflect agency-level programs as reported in the 2025 audit. Programs appearing under multiple program titles due to CIP or program-number changes are counted under their current designation. The tables underlying this analysis include 3,827 row entries against the report's 3,630 unique programs, reflecting these CIP transitions.

The 134 phase-out identifications are not evenly distributed across metrics, programs, or institutions. The findings below proceed from the most measurement-driven pattern to the most actionable program-quality signal.
Finding 1: A CIP-Transition Timing Gap Accounts for Most Metric 3 Identifications
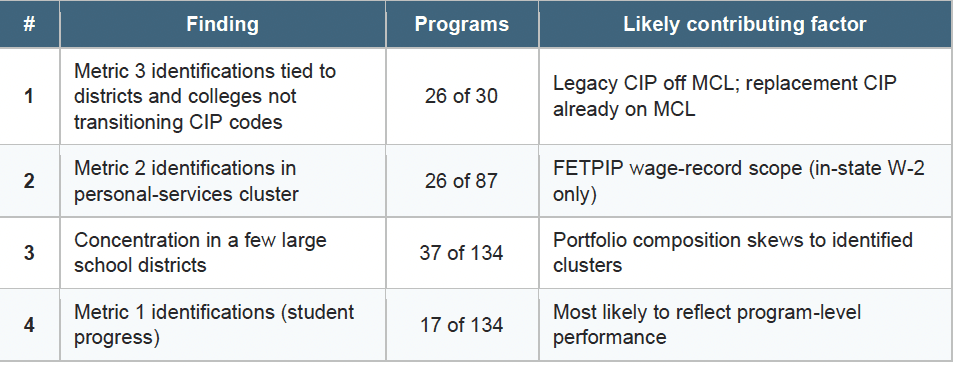
Of the 30 programs identified on Metric 3 (In-Demand Occupation), 26 share a specific structural pattern. Each is reported under a legacy CIP code that has been superseded by a replacement CIP under the state's curriculum frameworks. The legacy CIP does not appear on the 2025-26 Master
Credentials List. The replacement CIP — which covers the same program content under an updated designation — does appear on the MCL.
Firefighter I/II is the most concentrated example. All 23 statewide identifications of Firefighter I/II were attributed to Metric 3. The Firefighter I/II CIP is being replaced by a successor CIP titled simply "Firefighter," which appears on the current MCL. Pinellas County's two Jewelry Making and Repair identifications (Levels 1 and 2) follow the same pattern, with replacement CIPs titled "Jewelry Design and Repair 1" and "Jewelry Design and Repair 2" already on the MCL. Florida State College at Jacksonville's Insurance Sales Agent identification reflects a similar transition to a replacement CIP titled "Life Insurance Marketing."
The four Metric 3 identifications without a clear CIP-transition explanation are Veterinary Assisting Career Certificate (Lake School District), Veterinary Technology ATC (Eastern Florida State College), Early Childhood Education ATC (St. Petersburg College), and E-Business Technology ATC (Broward College).
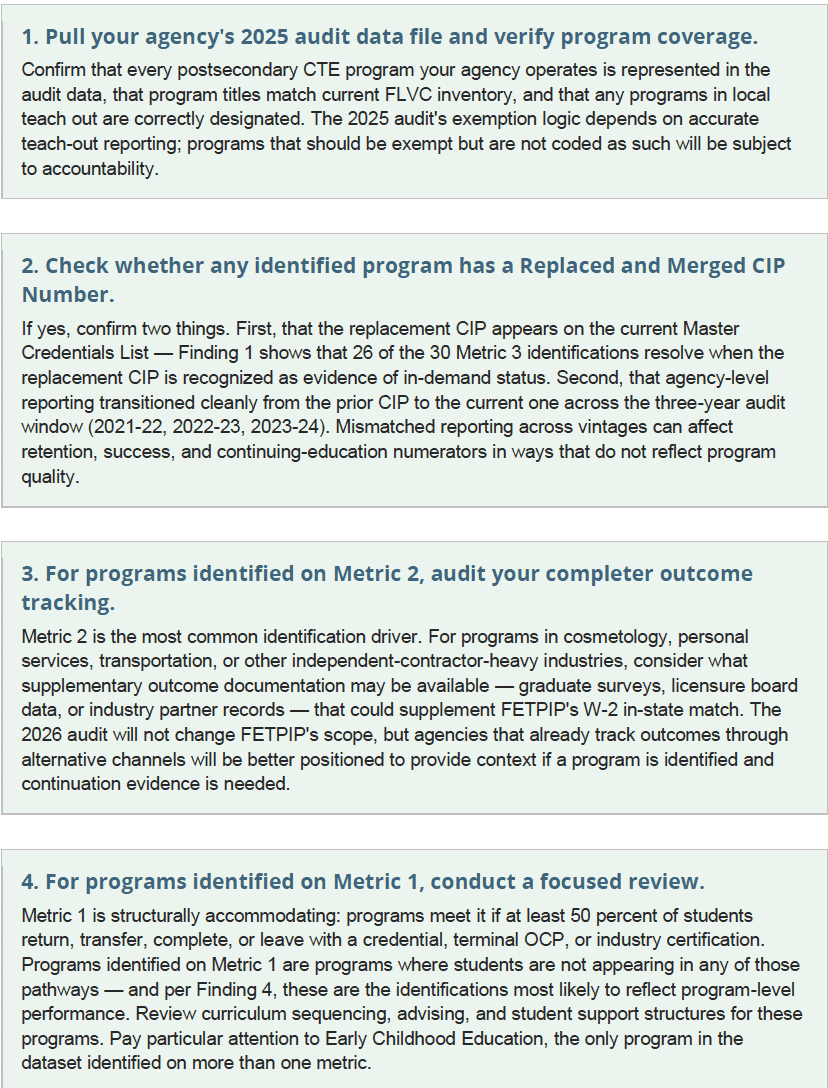
The implication is significant: 26 of the 30 Metric 3 identifications — 87 percent — are explainable as issues with agencies updating CIP codes, not as program-level performance differences. If the audit's Metric 3 review process treats the replacement CIP as evidence of in-demand status for programs already in CIP transition, the Metric 3 identification count would fall from 30 to 4.
Finding 2: Metric 2 Identifications Concentrate in Programs Affected by FETPIP Measurement Scope
Metric 2 — Continuing Education or Employed Rate — accounts for 87 of the 134 identifications, or 65 percent. Within Metric 2, identifications are not distributed evenly across program types. The personal-services cluster (cosmetology, barbering, nails specialty, and facials specialty) accounts for 26 of the 87 Metric 2 identifications, or 30 percent.
Metric 2 employment status is determined through FETPIP, which matches CTE completers against Florida unemployment insurance wage records. FETPIP measures employment captured by Florida W-2 records and does not capture employment outside Florida, employment by employers exempt from state unemployment insurance reporting, self-employment, independent-contractor income reported on Form 1099, or cash compensation. Personal-services programs share an industry structure characterized by booth rental, independent-contractor relationships, tip-based compensation, and high rates of self-employment. Many completers who are gainfully employed in their field of training would not appear in FETPIP records under current methodology.
Other Metric 2 identifications cluster in similar program areas: commercial vehicle driving (where interstate employment is common), heating/ventilation/air conditioning (where licensure-route employment may not appear in W-2 records), and several culinary and baking-and-pastry programs (where independent-contractor and tip-based compensation are common). Together with the personal-services cluster, programs whose industry structure is poorly aligned with FETPIP measurement scope account for a meaningful share of Metric 2 identifications.
While Metric 2 captures real signal for programs whose graduates predominantly enter Florida W-2 employment, identifications of programs in industries dominated by independent-contractor, self-employed, or out-of-state employment patterns may reflect measurement scope rather than employment outcomes. Resolution would require either a methodology update to FETPIP or an alternative-evidence pathway under Metric 2 comparable to the CLNA pathway under Metric 3.
Finding 3: Identifications Are Concentrated in a Small Number of Large School Districts
Of Florida's 68 reporting agencies, 22 have zero identifications, 18 have exactly one, and 21 have between two and four. Only 7 agencies have five or more identifications. The top three — Broward (16), Pinellas (11), and Miami-Dade (10) — account for 37 of the 134 identifications, or 27.6 percent. The top five account for 36.6 percent. The top ten account for 53 percent.
The concentration tracks closely with sector. School districts hold 86 of the 134 identifications (64 percent) despite operating only 30 percent of programs in the audit. The school-district identification rate is 7.6 percent compared with 1.8 percent for Florida College System institutions — a more than four-to-one difference. Every agency in the top four is a school district. Among Florida College System institutions with at least 20 programs in the audit, no institution exceeds a 4.3 percent identification rate.
Finding 4: Metric 1 Identifications Are the Smallest Cohort but the Most Likely to Reflect Program-Level Performance
Metric 1 — Retention or Success — accounts for 17 of the 134 identifications, or 13 percent. Metric 1 captures whether students re-enroll, complete, or transfer within the system, and is generally less exposed to the measurement-scope considerations that affect Metrics 2 and 3. A program that does not meet Metric 1 has students who, within the audit's three-year window, have not progressed within the system through any available pathways.
The 17 Metric 1 identifications are distributed across program types and agencies, with no dominant cluster. Metric 1 is the metric most likely to surface genuine program-level performance signal in the 2026 cycle. The 17 programs identified on Metric 1 in the 2025 cycle, and Early Childhood Education in particular, may warrant focused review by the responsible agencies independent of any state-level methodology adjustments.

Agencies have a single program year to interpret the 2025 results and respond. The five steps below translate the findings in Part 1 into agency-level action, organized by what an agency should do first regardless of whether it currently operates any identified programs. The steps are sequenced from data verification to engagement with the state.
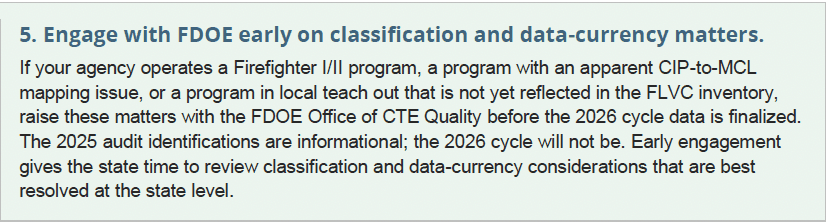
Looking Ahead to the 2026 Cycle
The 2026 audit cycle will be the first under which phase-out consequences attach. The 2025 results offer a preview rather than a forecast: the underlying methodology will be the same, but the program data, MCL contents, and CIP designations may all shift between cycles. The CIP-transition timing gap documented in Finding 1 may resolve in part if more replacement CIPs are propagated through institution-level reporting before the 2026 data window closes. The FETPIP measurement scope considerations documented in Finding 2 are unlikely to resolve without methodology change.
The most useful framing of the 2025 results may be neither alarmist nor dismissive. The 134 identifications include a small number of programs whose continuation deserves substantive review, a larger number whose identification appears tied to measurable methodology considerations, and a meaningful share whose identification reflects calendar-alignment issues that an administrative adjustment could resolve. A 2026 cycle that distinguishes among these layers — through a combination of state-level methodology refinement and agency-level continuation evidence — would produce results more closely aligned with the audit's stated purpose of evaluating CTE program quality.